Season 2017-2018. V1.
- Introduction.
Depending on the requirements of the orchards in production, maintaining a complete water status and permanent fertilization in the pre-harvest stage.
In general, the quality and condition of the fruit responds to an adequate and rational soil and foliar fertilization program, attributing action to the different nutrients in different phenological states according to the needs of the species. On the other hand, a deficiency of some nutrient at certain times or the total absence of a foliar fertilization program can have an adverse effect on the formation of quality fruit.
The incorporation of products via irrigation, being complementary to the fertilization program at this stage, could be of vital importance to ensure an optimal vegetative status and to further enhance the development of root recovery.
The objective of this research is to evaluate the applications of Mycoup® to improve the vegetative development and fruit condition of an orchard, analyzed by indicators of root growth, harvest, soluble solids among other parameters.
2. General materials and procedures.
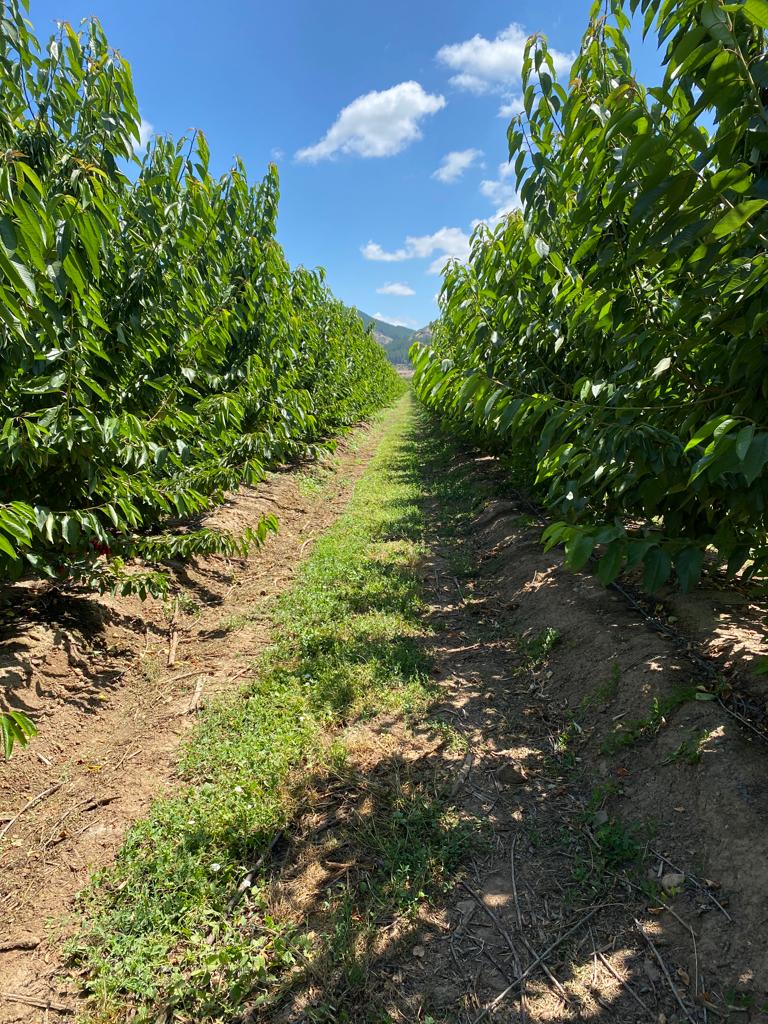
The research was carried out at Agrícola Santa Ana del Rosario Ltda. Santa Ana Farm in the Rosario sector of the Rengo commune, VI region.
Regarding plant material, the treatments were carried out on the Santina and Regina varieties as test 1 and test 2 respectively (Table 1).
The garden is established on a traditional central axis, with a 38 L/hour sprinkler irrigation system.
All cultural management measures were carried out in terms of phytosanitary, soil and foliar nutrition programs and cultural tasks such as pruning, load regulation, weed control, etc., were in accordance with the program to obtain fruit for export.
Table 1. Plant material intended for Mycoup® trial to improve vegetative development and fruit condition in a cherry orchard. 2017-2018 season.

2.1 Treatments.
An effective comparison was made in two treatments including a control.
Applications were made via soil irrigation on a date preliminarily determined for the Mycoup® treatments (Table 2).
Table 2. Treatment details and application date in Mycoup® trial to improve vegetative development and fruit condition in a Santina cherry orchard. Season 2017-2018.

Blocks of 10 plants chosen based on their similar vigor, load and health were used for the measurements detailed in point number 4.0 in response factors.
In the application blocks, borders between treatments are contemplated.
3. Experimental design and statistical analysis.
The experimental unit of the test was each plant with its respective treatment.
The experimental design will be completely random, with the experimental unit being the tree and the repetitions depending on each measurement detailed in point 4.0 of the development of the method and response variables.
The data were subjected to simple analysis of variance and those variables that had statistical significance were subjected to the Tukey multiple comparison test at the 5% significance level (p≤0.05).
All analyses were performed using Statgraphics Centurion v. XVI.II.
4. Development of the method and result of the response factors.
The application was carried out at the concentrations described above according to the phenological state of the plant (Table 2).
4.1 Essay 1. cv. Santina.
4.1.1 Root development.
In post-harvest, root development was measured expressed in weight (g.) in a given volume of soil, converting this result to weight (g.) of roots per 1 m-3 of soil volume (Table 3; Fig. 2).
For this purpose, cages measuring 43 x 23 x 30 cm in length, width and height respectively were used for each treatment, located 20 cm from each tree between the row and at a depth of 50 cm from its base (Fig. 1).
The period of root growth evolution was from 28.09.17 to 09.04.18.
For this, 10 repetitions were used for each treatment.
Figure 1. Dimensions (cm.) of cages for Mycoup® trial to improve vegetative development and fruit condition in a cherry orchard cv. Santina. Season 2017-2018.

Table 3. Weight (g.) of roots per volume (m-3) of soil for each treatment in Mycoup® trial to improve vegetative development and fruit condition in a cherry orchard cv. Santina. Season 2017-2018.

Figure 2. Root recognition for each treatment prior to cage extraction in the Mycoup® trial to improve vegetative development and fruit condition in a Santina cherry orchard. Season 2017-2018.

4.1.2 Production.
In the 10 repetitions per treatment, a trunk diameter of 20 cm was recorded above the union.
rootstock/variety to calculate trunk cross-sectional area (TSSA in cm2).
In addition, all fruits on the plant were counted prior to harvest to determine fruit load. The measurement corresponds to load density (ASTT-1 fruits) as a specific way of comparing treatments with respect to load (Table 4).
Regarding the production comparison, the specific load (Kg ASTT-1) was calculated for each treatment by recording the average fruit weight.
The specific production for each experimental unit (kg plant-1) and the production per unit of surface (kg ha-1) were also calculated and analyzed.
Table 4. Evaluation of ASTT, stocking density, specific stocking rate, specific yield and yield per area in Mycoup® trial to improve vegetative development and fruit condition in a Santina cherry orchard. Season 2017-2018.

4.1.3 Shoot growth curve.
Shoot length (cm) was measured for each treatment in each experimental unit.
For this purpose, one branch was selected for each unit (plant) to generate 50 repetitions for each treatment for the measurements of shoot length (cm) at the end of the season (Table 5).
Table 5. Shoot length (cm.) per treatment in Mycoup® trial to improve vegetative development and fruit condition in a Santina cherry orchard. Season 2017-2018.

4.1.4 Equatorial diameter and fruit weight.
250 fruits were collected per treatment to measure equatorial diameter in mm and fruit weight in g (Table 6; Fig. 3).
Diameter measurements were made with a digital measuring tape and the fruit unit weight with a low-scale scale.
Table 6. Diameter (mm.) and weight (g.) of fruits for each treatment in Mycoup® trial to improve vegetative development and fruit condition in a cherry orchard cv. Santina. Season 2017-2018.

Figure 3. Graph of diameter (mm.) and weight (g.) of fruits for each treatment in the Mycoup® trial to improve vegetative development and fruit condition in a cherry orchard cv. Santina. Season 2017-2018.

4.1.5 Caliber distribution.
Five replicates of 50 fruits each were used for each treatment for size segregation according to commercial packaging categories of Chilean cherries (Table 7).
Table 7. Distribution of Chilean cherry packing sizes for Mycoup® trial to improve vegetative development and fruit condition in a Santina cherry orchard. Season 2017-2018.
The result of the segregation according to caliber category was taken to percentage (%) of participation and compared between each treatment for each category separately (Table 8; Fig. 4).

Table 8. Segregation of fruit size in % in each category for each treatment in Mycoup® trial to improve vegetative development and fruit condition in a Santina cherry orchard.
2017-2018 season.

Figure 4. Segregation graph of fruit size in % for each treatment in Mycoup® trial to improve vegetative development and fruit condition in a cherry orchard cv. Santina. Season 2017-2018.

4.1.6 Penetration resistance (Durofel).
At harvest, penetration resistance was measured using the Durofel method as an indirect measure of fruit firmness.
Five replicates were used per treatment. The replicates were composed of a Durofel value calculated internally by the instrument from a total of 20 fruits (Table 9; Fig. 5).
These measurements were carried out in Avium's post-harvest laboratory, using the method commercially used for receiving fruit at the packing plant.
Table 9. Pulp penetration resistance measured as Durofel in Mycoup® test to improve vegetative development and fruit condition in a Santina cherry orchard. Season 2017-2018.

Figure 5. Pulp penetration resistance graph measured as Durofel for each treatment in Mycoup® trial to improve vegetative development and fruit condition in a Santina cherry orchard. 2017-2018 season.

4.1.7 Sugar content of fruits (soluble solids – SS).
At harvest, soluble solids (SS) of fruits were measured as a direct measurement of the internal sugar content in oBrix with the help of a manual analog refractometer.
20 replicates were used per treatment. Replicates consist of one measurement per fruit (Table 10; Fig. 6).
Table 10. Sugar content measured as soluble solids (oBrix) for each treatment in Mycoup® trial to improve vegetative development and fruit condition in a Santina cherry orchard. Season 2017-2018.

Figure 6. Graph of soluble S. (°Brix) for each treatment in the Mycoup® trial to improve vegetative development and fruit condition in a Santina cherry orchard. Season 2017-2018.

4.1.8 Nutritional and dry matter content of fruits.
At harvest, nutritional analyses and percentage of dry matter in fruits were performed for each treatment (Table 11, 12 and 13).
5 repetitions were used per treatment composed of 500 g of fruit for each repetition.
The analyses were outsourced to the Agrolab Laboratory based on its own sampling protocol.
Table 11. Nutritional content of fruits (mg./100g.) for each treatment in Mycoup® trial to improve vegetative development and fruit condition in a cherry orchard cv. Santina. Season 2017-2018.

Table 12. Nutritional content of fruits (mg./100g.) for each treatment in Mycoup® trial to improve vegetative development and fruit condition in a cherry orchard cv. Santina. Season 2017-2018.

Table 13. Dry matter percentage (%) measurement in Mycoup® trial to improve vegetative development and fruit condition in a cherry orchard cv. Santina. Season 2017-2018.

4.1.9 Distribution of fruit color intensity at harvest.
As an objective measure of the gain in coverage color intensity as the most important index in harvest, the percentage (%) of fruit participation in each color category was measured and recorded.
The harvest was carried out in one go by extracting 100% from the fruits of the tree at a time of commercial harvest of the orchard. With this, the color analysis of coverage intensity was carried out according to the Ctifl color table (Fig. 7).
Figure 7. Color intensity table for Chilean cherry harvest coverage.
Source: Ctifl.

Table 14. Percentage category analysis (%) of intensity colour in Mycoup® trial to improve vegetative development and fruit condition in a Santina cherry orchard. Season 2017-2018.

Figure 8. Percentage category graph (%) of fruit intensity color for each treatment in Mycoup® trial to improve vegetative development and fruit condition in a cherry orchard cv. Santina. Season 2017-2018.

4.2 Essay 2. cv. Regina.
4.2.1 Root development.
In post-harvest, root development was measured expressed in weight (g.) in a given volume of soil, converting this result to weight (g.) of roots per 1 m-3 of soil volume (Table 15; Fig. 9).
For this purpose, cages measuring 43 x 23 x 30 cm in length, width and height respectively were used for each treatment, located 20 cm from each tree between the row and at a depth of 50 cm from its base (Fig. 1).
The period of root growth evolution was from 28.09.17 to 09.04.18.
For this, 5 repetitions were used for each treatment.
Table 15: Weight (g.) of roots per volume (m-3) of soil for each treatment in Mycoup® trial to improve vegetative development and fruit condition in a cherry orchard cv. Regina. Season 2017-2018.

Figure 9. Root recognition for each treatment prior to cage extraction in the Mycoup® trial to improve vegetative development and fruit condition in a cherry orchard cv. Regina. Season 2017-2018.


