Analysis of the dynamics of fruit growth in cherry trees.
Part 1.
By: Carlos Tapia T., Agricultural Engineer M.Sc. – Technical Director Avium; David González O., Agricultural Engineer – Technical Assistant/AgTech Support Avium; Bruno Tapia Z., Agricultural Engineer – Technical Coordinator Avium Producers; Diego Humeres M., Agricultural Engineer – Irrigation-Climate Department.; Ricardo Rojas R., Agricultural Engineer – Technical Advisor Avium Producers; Ignacio Botto R., Agricultural Engineer M.Sc. – Technical Advisor Avium Producers.
In cherry cultivation, understanding the dynamics of fruit growth is essential for making technical decisions that impact the final quality of the fruit.
From a technical point of view, it has been shown that fruit thinning has an effect on the size and final weight of the fruit, mainly when it is carried out before the start of stone hardening, about 25-30 days after full flower (DDPF) (Tapia C., Tapia B. 2021). On the other hand, applications of gibberellic acid (GA)3), have a good place in programs with the aim of enhancing the size and hardness of the fruit from the beginning of cell elongation, or the straw-colored state of the fruit, activating enzymes (expansins) in the cell wall that increase its elasticity, allowing an increase in size due to elongation (Tapia, 2022).
Fruit growth dynamics are divided into three stages: stage I, cell division; stage II, pit hardening; and stage III, cell elongation. According to Gil, 2009, the fruit growth curve is represented as a double sigmoid curve. Strictly speaking, the time scale of the curve is represented in days after full flower (DDPF), considering that, according to the technical guide of phenological states presented by the Pomanova Corporation in 2020, in cherry trees “full flower” is defined when around 80% the open flower state with the highest proportion of receptive flowers predominates, that is, when about 8 out of 10 flowers have unfolded their petals for pollination (anthesis).
Two weeks before full flower, mitotic activity (cell division) is already reflected in the ovary, subsequently from the full flower state the division rate is increased reflecting radial and tangential growth, with a growing phase and a decreasing phase until reaching the beginning of stone hardening (stage II), where the rate is considerably decreased, this is because at that time the activity is concentrated in the lignification of 26-27 layers of cells that will make up the endocarp or stone (Vignati et al., 2022). Stage III begins at the “stone hardening end” stage (Pomanova, 2020), which, in practice, coincides with the “straw color” phenological stage or, failing that, in practice, “beginning of veraison”, where cell division ceases and “cell elongation” begins (radial elongation of the cells from the area near the stone), thus increasing the fruit growth rate. For this reason, the use of AG-based products3, positioned at that time, is key to successfully achieving the goal of producing quality fruit.
Finally, the duration of the entire process from full flower to harvest could take between 55 to 80 days, depending on the rootstock/variety combination, geographical area, protection systems, technical management, among others.
Figure 1. Double sigmoid curve and theoretical growth rate in cherry fruits.

During the 2022-2023 season, Avium's technical team monitored the fruit diameter in different combinations, with the aim of constructing the real fruit growth curve.
Five trees were selected for each variety, and two branches were marked on each one, facing east and west. Two shoots were selected for each branch, and two fruits were inside each shoot. In other words, 8 fruits per plant and 40 fruits per variety were measured weekly until harvest.
Each selected plant shared characteristics of vegetative expression, fruit load and phytosanitary status in the two varieties.
Data analysis and curve visualization were performed using R software version 4.3.1 in the R Studio programming environment.
Table 1. General information on combinations evaluated.

All the combinations evaluated showed a double sigmoid behavior in terms of their growth. The fruit growth rate in stage II is significantly lower. The beginning and end of each stage in time scale depends on each particular combination.
The fruit growth curve for Santina on Colt and MaxMa 14 rootstocks was similar until the end of stone hardening, however, it can be observed that around 45 DDPF the growth rate in MaxMa 14 decreases. This is reflected in practice, where, commonly on MaxMa-14 the difficulty to reach a size over 2J is greater.
Figure 2. Growth dynamics of Santina fruit on Colt and MaxMa 14 rootstocks as a function of DDPF. Source: Avium 2023.

It is not enough to analyze the accumulated growth curve individually; it is important to incorporate the mathematical concept of rate of change (better known as rate or derivative) into the analysis in order to identify the inflection points, which, in this particular case, will correspond to the changes in the growth stage of the cherry fruit.
For the Santina variety, as shown in Figure 3, stage II begins around 15 DDPF and ends around 35 DDPF, i.e. the stone hardening period for the Santina variety lasted @ 20 days.
In addition, it can be identified that stage III has a growing phase and a decreasing phase, the first phase is longer on MaxMa 14 rootstock and does not reach the accumulated Colt, consequently, the final caliber is relatively smaller.
Figure 3. Fruit growth rate of cv. Santina on Colt rootstock and MaxMa 14. DDPF: Days after full flower. Source: Avium 2023.

When looking at the differences in the growth curve of the two main varieties in terms of surface area and production in Chile, Lapins and Santina, the double sigmoid behaviour is again identified, highlighting the shift to the right of the Lapins variety. From full flower to harvest in Lapins approximately 70 days pass, while in Santina about 60.
Figure 4. Growth curve of fruit cv. Santina and cv. Lapins on Colt. rootstock. (S): Santina; (L): Lapins; @: Approximately; DDPF: Days after full bloom. Source Avium 2023.

According to Figure 5, the onset of stone hardening, unlike in Santina, in Lapins begins around 25 DDPF, and the fruit growth rate in mm/day in stages I and II is lower for this variety. The maximum instantaneous rate in stage III for both varieties is @0.5 mm/day, right where the inflection point for the decreasing phase of the same is identified.
Figure 5. Fruit growth rate of cv. Santina and cv. Lapins on Colt. rootstock. (S): Santina; (L): Lapins; @: Approximately; DDPF: Days after full flower. Source: Avium 2023.

The duration of each stage of fruit growth in cherry trees is shown in Table 2, which was prepared based on data obtained during the 2022-2023 season. This estimate was made exclusively based on DDPF, however, it is important to consider and evaluate in the future the impact on growth rates and the durations of these stages based on agroclimatic variables such as the accumulation of degree days or degree hours with the optimal base temperature for analysis.
Table 2. Duration in days for each stage of fruit growth in cherry trees.

*Consider +-3.5 days error. Estimate based on weekly measurements. Estimate may vary based on environmental factors, technical handling, etc.
It is important to note that the fruit growth rate is dynamic, showing highs and lows visualized in its instantaneous curve; however, seeking a parsimonious representation, Table 3 shows the average of its daily growth, which is more attractive for practical purposes.
Table 3. Average growth rate mm/day at each stage of fruit growth.
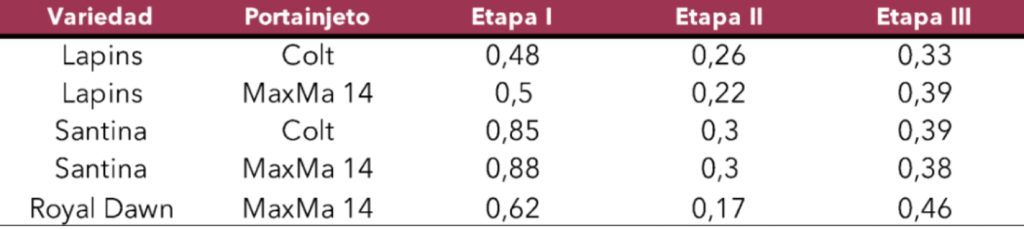
Estimate based on the average of each stage and may vary based on environmental factors, technical management, etc.
As a general rule, the beginning of stage II occurs with a caliber of between 12-13 mm. From then on, the growth rate is considerably reduced until the formation of the stone is complete and then the cell elongation of stage III continues.
At the end of the stone hardening, according to the observed results, we have @65% of the caliber obtained at harvest. Thinking objectively about late load adjustment tasks and its effect before the end of the stone hardening taking advantage of the increasing rate of stage III, the growth rate data in stage II of @ 0.24 and @ 0.3 mm/day in Lapins and Santina respectively, is a crucial objective indicator to project a week before straw color if the target caliber will be achieved at harvest above 28 mm. in diameter as an objective.
Literature.
Pomanova Corporation. 2020. Main phenological stages of the sweet cherry (Prunus avium L.) In Chile.
Tapia, C., and Tapia, B. 2021. Fruit thinning in cherry trees: real impact on potential?. Smartcherry. https://smartcherry.cl/opinion-expertos/raleo-de-frutos-en-cerezos-real-impacto-en-el-potencial/. Revised on 01-09-2023.
Tapia, C. 2022. Gibberellic acid and its role in increasing fruit size. Smartcherry. https://smartcherry.cl/opinion-expertos/acido-giberelico-y-su-rol-en-el-aumento-del-tamano-del-fruto/. Revised on 01-09-2023.
Vignati, E., Lipska, M., Dunwell, JM, Caccamo, M., & Simkin, AJ 2022. Fruit development in sweet cherry. Plants, 11(12), 1531.